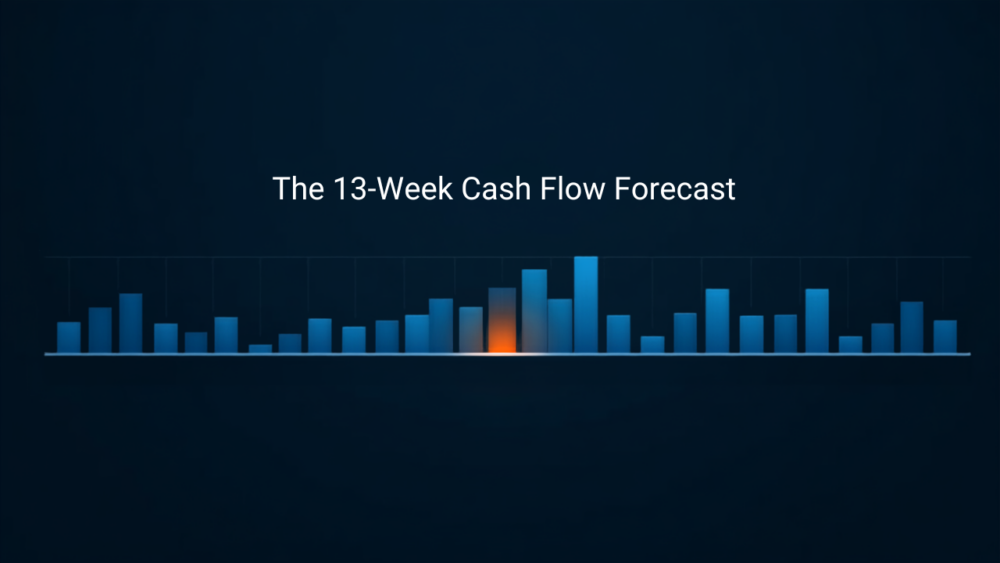
The 13-week cash flow forecast is the first document a restructuring advisor requests when they walk into a business in trouble. Banks ask for it before granting a covenant waiver. Private equity firms run one during due diligence. It is the financial tool used specifically in situations where knowing exactly what happens to your cash, week by week, for the next quarter is not optional. Most small businesses have never heard of it. That is a missed opportunity, because the same structure that helps a distressed business survive also helps a healthy one avoid becoming one.
What Is a 13-Week Cash Flow Forecast?
A 13-week cash flow forecast is a rolling, week-by-week projection of every cash inflow and outflow for the next 13 weeks, equivalent to one financial quarter. It is updated weekly: as each week closes, a new week is added to maintain the rolling 13-week window. Unlike a monthly cash flow statement, which is backward-looking, or an annual budget, which is too distant to be actionable, the 13-week forecast lives in the near-term future where decisions still matter.
The structure is straightforward:
| Category | What It Includes | Source |
|---|---|---|
| Opening cash balance | Cash in all bank accounts at start of week | Bank feeds / accounting software |
| Cash inflows | Expected customer payments, loan draws, other receipts | Accounts receivable aging, contracts |
| Cash outflows | Payroll, rent, supplier payments, loan repayments, tax obligations | Accounts payable, fixed cost schedule |
| Net cash movement | Inflows minus outflows for that week | Calculated |
| Closing cash balance | Opening balance plus net movement | Calculated (becomes next week’s opening) |
The power is in the closing balance column. Each week’s ending balance feeds directly into the next week’s opening. A single large payment that arrives one week late ripples through every subsequent week in the model. That visibility is exactly what makes it useful.
Why 13 Weeks, Not a Monthly View or 90-Day Rolling Total?
Thirteen weeks is one quarter. It is long enough to see structural patterns (a slow-paying client that drags every month, a quarterly tax obligation that recurs) but short enough to forecast with reasonable accuracy. Monthly forecasts miss intra-month timing entirely. A business can show positive monthly cash flow while going into the red for two weeks in the middle of that month, which is exactly when it needs a credit line or has to make a hiring call.
The weekly granularity matters most when obligations do not align neatly with revenue. A business that invoices on the 1st but pays salaries on the 15th and rent on the 30th can look fine in a monthly view but face a real cash gap mid-month. The 13-week weekly model surfaces that gap when there is still time to do something about it. For accountants advising clients, this is also why a weekly cash view is a more defensible advisory tool than a monthly one: it gives clients more lead time to act.
How to Build a 13-Week Cash Flow Forecast
You can build a basic version in a spreadsheet in an afternoon. Here is the framework, step by step:
- Pull your current bank balance. This is your Week 1 opening balance. Use today’s balance across all operating accounts, not a balance from your accounting software if there is a reconciliation lag.
- List all expected cash inflows by week. Start with your accounts receivable aging report. Any invoice that is due or overdue should be mapped to the week you realistically expect payment. Add any contracted or recurring revenue on its expected payment date, not its invoice date.
- List all known cash outflows by week. Fixed costs first: payroll (by pay date), rent, loan repayments, insurance. Then variable: supplier invoices due, ATO or IRS obligations by their due date, software subscriptions. Be specific about dates. “Rent due monthly” is not good enough. Rent due the 1st of each month goes into the model on the 1st.
- Calculate closing balance for each week. Opening balance plus inflows minus outflows. If any week shows a negative closing balance, that week is a cash gap. You now have a visible problem with a specific date attached to it rather than a vague anxiety about money.
- Update it every week. Roll the forecast forward: close out Week 1 with actuals, add a new Week 13. Replace forecasted inflows with actual payment receipts. The variance between forecast and actual for Week 1 tells you how accurate your assumptions were, which helps you calibrate the next 12 weeks.
How to Use the Forecast Once You Have It
A 13-week forecast is only useful if you act on what it shows. When the model reveals a cash gap in a specific week, you have three to twelve weeks of lead time to address it. That lead time is the asset. Here is what that looks like in practice:
A gap in weeks 3-4: Accelerate collections now. Call the invoices closest to due. Consider a short-term draw on a line of credit if you have one. Ask a supplier with a long-standing relationship for a 30-day extension on a payable.
A gap in weeks 7-10: You have time to adjust plans. Delay a discretionary spend. Restructure a supplier payment. If the gap is driven by a tax obligation, check whether an instalment variation or payment plan is available.
A gap in weeks 11-13: Use this time to arrange facilities, not to panic. A bank is far more willing to extend a credit line to a business that is showing them a forecast with a projected gap than to one that has already missed a payment.
The businesses that hit a cash wall are almost never surprised by it in the data. They just did not have the cash flow visibility to see it coming. A 13-week forecast, updated weekly, eliminates that blind spot. For businesses that have identified a potential gap, scenario modeling lets you test whether different collection or payment strategies change the outcome before you have to commit to any of them. And if you want to understand the early warning signs of a cash flow crisis, the 13-week model is often where they first become visible.
Build Your First 13-Week View From Your Real Data
The hardest part of a 13-week forecast is not the math. It is getting clean, current data into one place. Finoya connects directly to QuickBooks or Xero and builds a forward cash view from your actual receivables and payables, updated as your accounting data changes.
Create your free Finoya account and see your next 13 weeks of cash flow in the time it takes to connect your accounting file.