
The monthly CFO report has been one of the most-requested features from our accounting firm partners since we launched. Most small businesses never see a proper CFO-level monthly review. Not because they don’t need one, but because it takes a real CFO three to six hours per client to put one together, and that labour cost makes the report economically unavailable to any business under about $10 million in revenue.
That is the gap we set out to close. Noya, our AI, generates a full monthly CFO report for any business connected to Finoya. The firm or the founder can download it as a PDF or a Word document, edit it if they want to, and forward it to whoever needs to see it. The generation takes under 90 seconds. The cost is included in the subscription.
Below is a full walkthrough of the report, section by section, using data from a real demo account we use for onboarding new accounting firms. The business in this example has strong revenue growth but collapsing gross margins, which makes it a good teaching case. We will go through each section, explain what it is for, and show what the reader is supposed to do with it.
If you want to see the source report before reading further, the full two-page PDF sits at the end of every trial account. You can generate your own from your own numbers within about five minutes of connecting Xero or QuickBooks.
Section 1. The cover and situation summary
Every CFO report starts with one paragraph. Not a dashboard, not a chart. A paragraph that tells the reader what is going on in their business right now, in plain English. The point of this paragraph is that an executive should be able to read it and know whether to keep reading, stop and call someone, or forward it to their accountant.
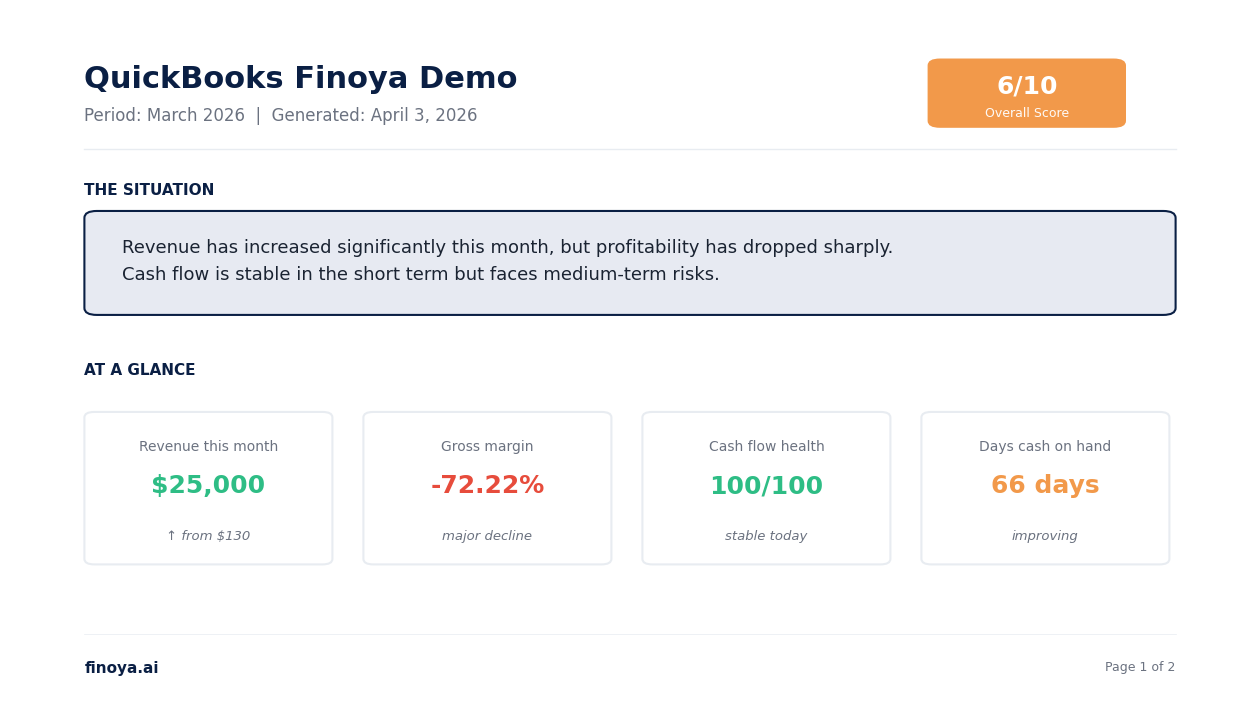
In the demo above, the situation paragraph reads: Revenue has increased significantly this month, but profitability has dropped sharply. Cash flow is stable in the short term but faces medium-term risks.
That is the entire story in two sentences. If you are a founder reading this on your phone, you know immediately that something is wrong with profitability even though the top-line looks good. If you are an accountant scanning ten client reports on a Monday morning, you know this is the client you need to call this week, not next week.
The overall score in the top right (6/10 in this case) is a composite number that rolls up the eight dimensions of the health check. Anything above 7 is healthy. Five to seven is mixed. Below 5 is a business that needs active intervention. The score changes month to month as the underlying data moves. It is designed to be the one number that tells you whether the business is getting better or worse over time.
The “at a glance” row below the paragraph shows four numbers that the CFO has decided matter most this month. These are not the same every month. Noya picks them based on what is most notable in the data. In this case, revenue is up, gross margin is down, cash flow health is stable, and days cash on hand is 66. That combination tells a specific story, and Noya writes the rest of the report around that story.
Section 2. The health check
This is the section accountants tell us they use the most. Eight dimensions of business health, each scored 0 to 10, with a one-sentence CFO take next to each. The same eight dimensions every month. That consistency is the point. It lets a firm track whether a client is improving or declining over time, across any industry, without having to build a custom framework.
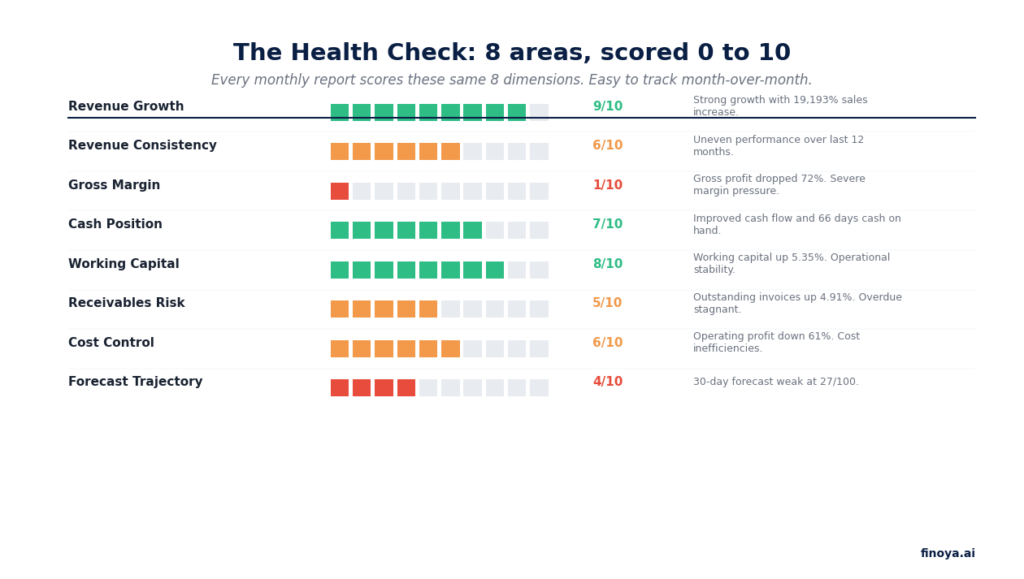
The reason the scores are presented as 0 to 10 instead of percentages or letter grades is because 0 to 10 is the way investors, bankers, and CFOs already think about risk. It is the language the audience already speaks. A 1/10 on gross margin is a five-alarm fire. A 9/10 on revenue growth is a standing ovation. You do not need to explain what it means.
The CFO take column is the part that is hardest to automate well, and the part we spent the longest on. A bad AI-generated take sounds like “gross margin declined this month” which tells you nothing you did not already know. A good AI take sounds like “gross profit dropped 72% this month, indicating severe margin pressure.” That difference, between restating the number and telling you why it matters, is the difference between a report the user reads and a report the user ignores.
We benchmark every generated take against how a senior accountant would describe the same number. When the take drifts too close to describing the number without interpreting it, the model gets retrained on better examples. This is slow work, but it is the work that makes the report actually useful.
Section 3. What is working. What is breaking.
This is where the report shifts from diagnosis to narrative. Every business has things going right and things going wrong in any given month, and the job of a good CFO report is to name both honestly.
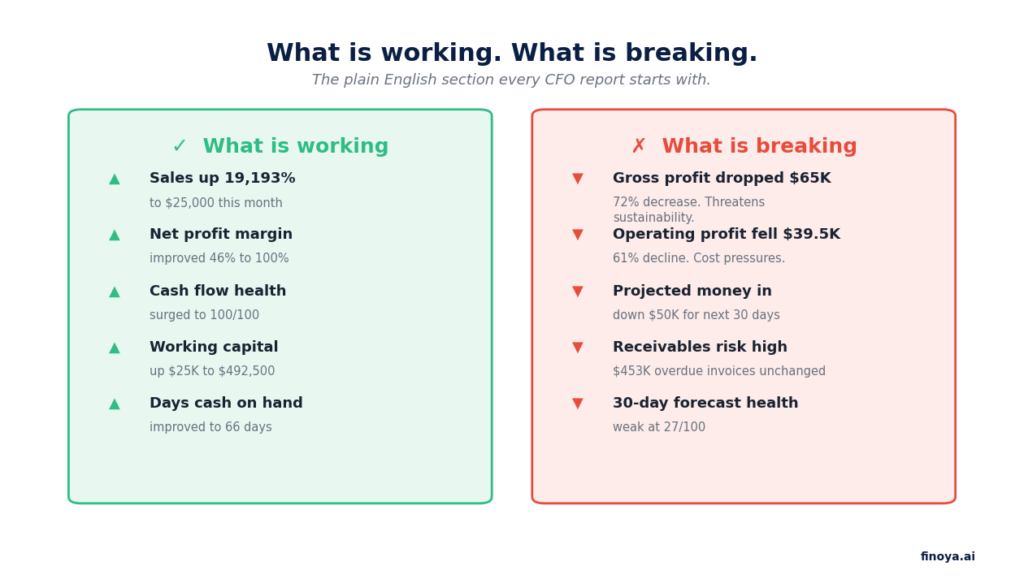
The “what is working” column exists for two reasons. First, because in a tough month a founder needs to see the things they are getting right, or they lose hope. Second, because sometimes what looks like good news actually is good news, and the founder should know to double down on it. In the example above, sales are up 19,193% which is genuinely remarkable even if the gross margin collapse is cancelling most of that progress.
The “what is breaking” column exists because most founders are optimists and most founders underweight bad news until it is too late to do anything about it. The job of a CFO is to be the one person in the room who is allowed to say the thing nobody wants to hear. The AI version of that role has to do the same thing, or it is not doing the job.
Every item in both columns is tied to a specific number. Not vague qualitative statements. Gross profit dropped $65,000, not “margin is concerning.” Operating profit fell $39,500, not “costs are a worry.” Specificity is what makes the report credible and what makes it actionable. Vague CFO reports are one of the main reasons founders stop reading them after a few months.
Section 4. The biggest risk
If a founder only has 60 seconds to read the report, this is the section they should read. It names the one thing that is most likely to damage the business over the next 90 days, explains why it matters now rather than later, describes what happens if nothing is done, and gives a concrete action to take.
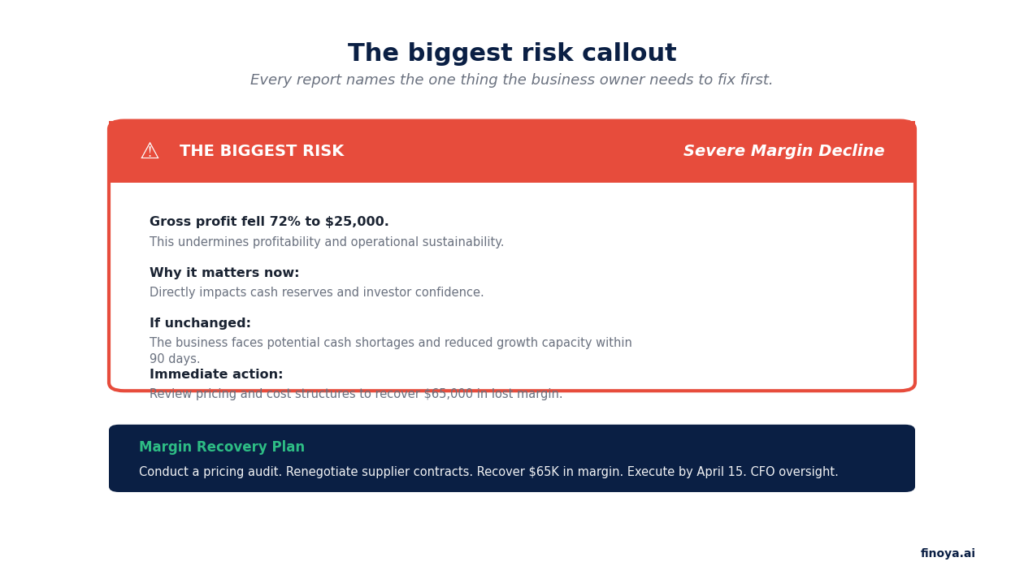
The structure of this section is not accidental. A risk without a timeframe is a worry. A risk with a timeframe and no action is a complaint. A risk with both a timeframe and an action is a plan. We force Noya to always include all three. When it cannot, it does not produce the section at all, because a partial risk callout does more harm than good.
The recovery plan at the bottom of the section has a deadline and an accountable party. In this case, “execute by April 15 with CFO oversight.” Real CFOs write recovery plans this way because recovery plans without deadlines and owners do not get executed. We built the same discipline into the AI.
One thing worth flagging. The biggest risk is not always the most interesting number in the report. Sometimes it is a slow-moving, boring risk that is going to compound for six months before it becomes a crisis. The AI is trained to surface those over more dramatic but less consequential issues. A 20% drop in gross margin is more important than a 200% drop in a single expense line, even though the second number looks scarier. We weight by business impact, not by how attention-grabbing the number is.
Section 5. The 30, 60, and 90 day action plan
The final section is the part most CFO reports get wrong. Most reports end with a dashboard. The reader closes the PDF and goes back to their day. Nothing happens.
A useful CFO report ends with an action plan sequenced by time horizon. Stabilise first, optimise next, grow third. The sequence matters because doing them in the wrong order is how businesses go from a bad month to a crisis. You cannot optimise a business that is bleeding cash. You cannot grow a business that has not stabilised. The 30, 60, 90 day structure forces the right order.
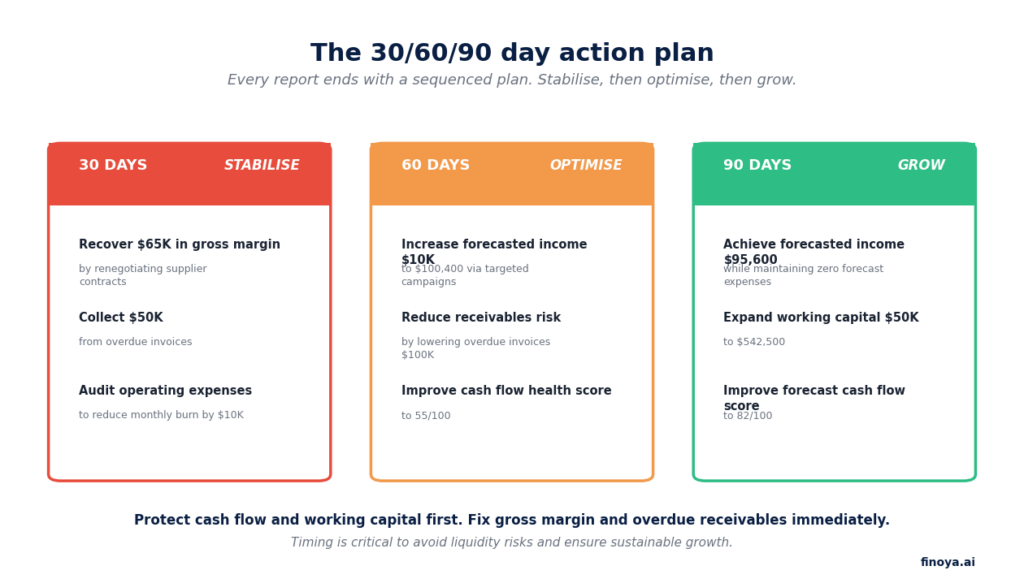
In the 30 day stabilise phase, every action is about stopping the bleeding. Recover $65,000 in margin by renegotiating suppliers. Collect $50,000 from overdue invoices. Audit operating expenses to reduce burn by $10,000. These are the things the business has to do before anything else matters.
In the 60 day optimise phase, the actions shift to tuning what is working. Increase forecasted income by $10,000 through targeted campaigns. Reduce receivables risk. Improve the health score. These actions assume the stabilise phase actually worked, and they compound on top of it.
In the 90 day grow phase, the actions assume the business is healthy enough to invest in expansion. Achieve higher forecasted income. Expand working capital. Lift the forecast health score into the 80s. This is where a business that has survived the crisis goes from defensive to offensive.
Every action in every phase has a specific number attached to it. That is not a stylistic choice. A plan without numbers is not a plan, it is an aspiration. An aspiration does not change behaviour.
How accountants use this report differently
For firms running Finoya on behalf of their clients, the monthly report does a different job than it does for a direct SME user. The firm uses it as the agenda for their monthly advisory call. The client has already read the report before the meeting. The call is no longer about explaining numbers, it is about working through decisions on the recovery plan.
This is the shift from compliance work to advisory work that the accounting industry has been trying to make for five years. The barrier was never that firms did not want to do advisory. The barrier was that it took too many hours per client to generate the material the advisory call depended on. The report takes those hours off the firm’s plate. The firm keeps the conversation.
On the white label side, the report generates under the firm’s brand. The client downloads “Your Monthly CFO Report” from the firm’s portal, not ours. The firm can edit any section before they send it if they want to add context only they would know. Most firms do not edit much. The default report is already in the language an accountant would use.
How to see one of these for your own business
If you are a founder, the fastest way to see what your own monthly CFO report would look like is to start a free trial. Connect Xero or QuickBooks. The first report generates in under 10 minutes after sync completes. Seven days, no credit card. If the report is not useful to you, you walk.
Start a trial at app.finoya.ai.
If you are an accounting firm or a fractional CFO and want to see how this report works under your brand for your clients, the fastest way is to book 20 minutes with us. We will walk through what white label setup looks like for a firm your size and show you the report generated for one of your own clients’ books. If it is not a fit we will tell you and point you somewhere else.
The monthly CFO report is not the whole product. It is one output of it. But it is the output that most founders and accountants tell us changes how they run their Monday mornings. That is the part we wanted to get right.